Thursday, October 27, 2011

Risk on - can it continue? Buy upside calls for a down move

Risk on - can it continue?
As we have been calling for a rally for sometime, the next question is can it continue?  The data is not clear, but little upside is left.  Let’s examine EM Risk, Long/Short, Financials, Yield and Vol

1. EM Risk attitude can still get more attractive, expect more inflows
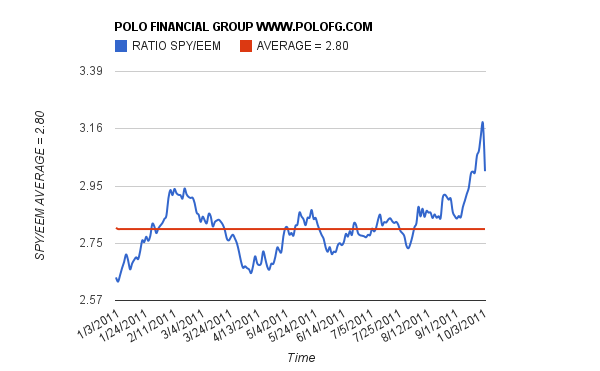

2. Long Short world no longer has a clear edge, it still sits with 10% move in any direction - same story, high correlation, not working. 
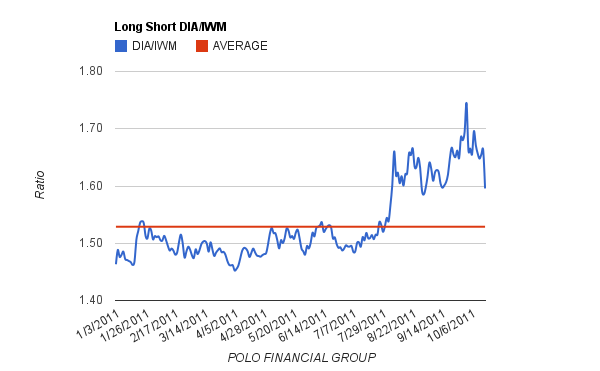


3. The financials could still rally, however now that earnings are out, it is clear they should be down 50% - Financial stock ROE’s have been cut in half. Who is holding worthless CDS is also a looming question?
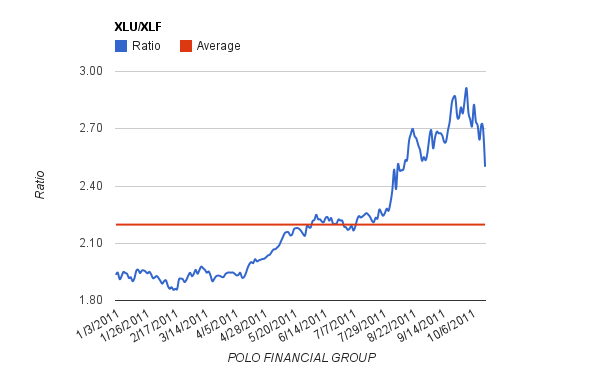


4. The hunt for lower quality yield continues and still has edge - this trade supports our lower long term vol thesis


5. Global Vol Levels decimated - now that no one wants it, is short term vol a buy?

Vol Risk Adjusted with Gold - selling vol has very little edge from here.


From the above data, we can conclude a a few things

1. EM Risk has room to rally
2. DM Risk will not get much further help from financials, making it hard for the index to rise
3. Long/Short trades are not screaming edge in any direction - correlation remains very high
4. Yield trades are a must and still offer edge (this has probably been slow due to the fact everyone is dumping bonds to buy stocks, it will reverse)
5. Vol in the short run is very close to fair values and getting long at lower levels makes more sense then shorting it here for a few points - buy upside calls delta hedged heavy, they will stay sticky in a down move (everyone is selling them up here)

The above points would indicate at best, this market has little juice left to rally and we are more inclined to sit and wait for a short market, short vol trade or a term structure trade to buy short dated upside calls vol and sell the back end.

Tuesday, October 25, 2011

Variance Swap and Vol Levels continue to spiral downward - however Asia and Europe variance spreads still high.

Variance Swap and Vol Levels continue to spiral downward - however Asia and Europe variance spreads still high.

With global volatility levels collapsing as was indicated by our thesis based trades on the de-levering consumer, Euro Zone issues fading and US Earnings/Economics dominating the spotlight, finding volatility edge has become increasingly difficult.

PFG needs one more box to be checked and that is “need” for vol or supply/demand of vol seems to fairly distributed in the market.  When this is out tilt, we can then look at putting on another vol trade.  

Our last trade took advantage of these dis-allocations in the market and performed +50%, this however was a trade, rather then a investment in a vol thesis.


1. Vol Levels continue to collapse


2. Largest daily vol drop seen this year - correlating well to our market rally call

3. Risks in Asia and Europe still not out of the woods.


We continue to wait patiently for another vol based trade, however PFG is exploring a short vol, short delta trade in the meantime.  These trades are especially difficult even if the edge is clear, getting the correct delta can prove to very hard no matter how much back testing one has done.  The primary thesis for this trade is that money continues to be placed into market in a rather less violent way so we can get a grind down situation as strong hands are probably unloading stocks on the weaker players who missed the rally.

Friday, October 21, 2011

Crap and Web Protect Baskets - Portfolio Recap and patiently waiting for the next vol trade

Crap and Web Protect Baskets - Portfolio Recap and patiently waiting for the next vol trade

In spite of our thesis being fully intact - call for a market rally and vol collapse, our fundamental indicator of supply and demand is still not a giving a green light signal.  The market players are not piled up in a long or short vol trade at the moment, making finding edge a bit harder.

However, we continue to focus on two equal weighted baskets and continue to add on any dips.


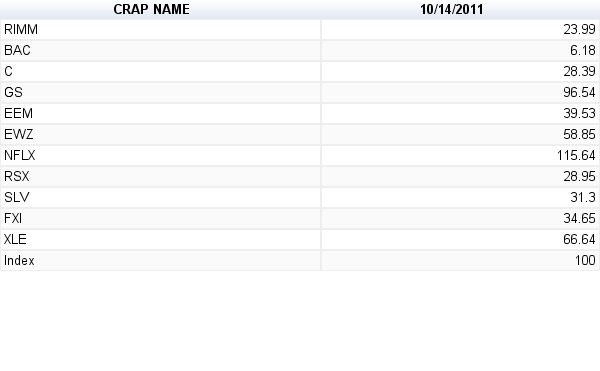
1. Crap Basket - Thesis simply revolves around out of favor stocks.  Time Frame is now to year-end
2. Web Security - Thesis focus is a hedge for short vol and paradigm shift for corporations creating a real “need”  Time Frame is 12 months.


Thursday, October 20, 2011

Recap - Trade Performance + 50%, Pain Trade thesis still intact.

Recap - Trade Performance + 50%, Pain Trade thesis still intact.


Recently we looked analytically at developing a pain trade thesis.  To review, we asked

What is the max pain path in the market short term?
  • Up
  • lower volatility levels
  • Raise in longer dated vols
  • Europe/SPX spreads blowing out
  • Interest rates raising
  • Gold/Defensive stocks sinking
  • Financials/Materials raising
  • IWM sinking and Blue chips outperforming


Our trade of choice was to buy calls on XLF, which we traded for a +50% return


In addition, the market had a major rally, volatility levels collapsed in absolute terms and the curve had a massive shift.


Our pain trade thesis is still intact, we continue to see elevated levels of index dis-allocation


Over in Europe, we picked up how during the sell-off, markets started to pay very little premium for Euro Stoxx Var over SPX (traders rushing to unwind the spread and keep whatever profit) have again started to blowout as nobody was left on the margin to sell.


PFG believes that the speed of the current rally probably as well reflects the speed at which market participants have worked to get back to correct weightings.  This makes finding volatility edge tougher in the market.   Our next trade will have to come as a re-active bet from another dis-allocation.  PFG anticipates this should become more visible as we approach year-end and traders will clean out books to start a fresh year.

Wednesday, October 19, 2011

Closed XLF trade - Trade Performance +50%

Closed XLF trade - Trade Performance  +50%


PFG closed out XLF Oct 13 calls today.  The short term pain thesis worked out well as financials rallied from massive index dislocations and funds underweight financials.

Tuesday, October 18, 2011

Web Security - Next Bubble?

Web Security - Next Bubble?

In an earlier post, we reviewed the many revolutionary steps that are taking place in Wall Street and the amount of disruptive technology that is making many functions and processes currently done by humans, obsolete.  One way PFG believes to play this new world is to own a basket of web security stocks.  Not only do we believe this is great hedge for our long term-short vol thesis, the stocks are fairly priced in the market.

At this point, we cannot find an ETF, but are very sure one will probably get listed.  The current events of protesters, hackers and the recent outage at blackberry are pointing more and more for a “real need” for stronger online security.  No exec wants to make it easy to access his personal info, no bank wants client information reveled and a caring father wants his daughters pictures of the web asap.  The uprising of social media tools, supporting the narcissistic facebook epicenter of global information is just staggering.  Many companies exist currently to help with managing your global identity, however they cannot do much once information security has been comprised.  As the world moves on-line, forced faster then ever before to reduce costs and adapt these new disruptive technologies, PFG believes on-line security will be at the top the list with compliance at most banks. In addition, it will also be the front gate for data mining, real time business intelligence and accessing proprietary correlation data.

Basket
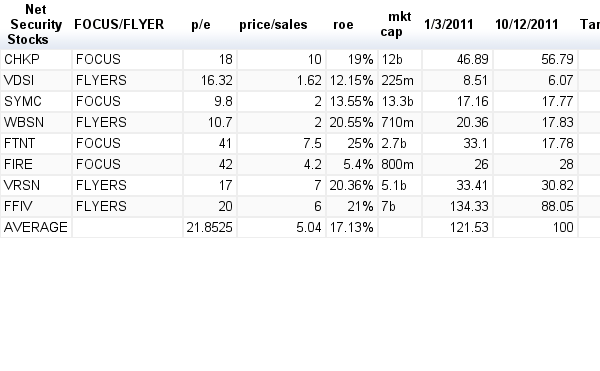

We are building a position on this equal weighted basket on dips in the market, with a 12m + time horizon, unless we reach our 25% upside target sooner.  We started building our position on Oct 12 2011 and set the index to 100.  The basket was down 21.5% for the year before we decided on this thesis.

Monday, October 17, 2011

Massive Volatility Collapse - Expect More

Massive Volatility Collapse - Expect More

Earlier this week, we identified some ST pain trades in the market.  In addition, we positioned for a market rally by looking at the following

1) Cash Levels
2) Inverted Vol Curve
3) Outflows making new highs

A risk on moment brought on a incredible market rally with a subsequent volatility collapse.

In just two weeks, Global Volatility Levels have collapsed,

Friday, October 14, 2011

In this low quality macro environment, high quality stocks is not the answer. More Pain

In this low quality macro environment, high quality stocks is not the answer.  More Pain

One quick look at how this market has unfolded to get to this spot has been the constant selling of low quality names and hiding in Gold/Bonds/Utilities.  PFG is building a basket of crap names that are very out of favor which potentially could provide very out-sized returns in the short term.  Building on our thesis of going long financials early this week, we start by looking at the data

1. DIA/IWM


2. XLU/XLF


In spite of calling for a rally after reviewing all the risk metrics.  This market has moved quicker then we anticipated.  We believe the market will take a small dip and then raise quickly higher, however based on not going long high quality, but rather on low quality, momentum names.  This is probably the most unexpected of all market outcomes and probably leaves most people in shock and awe at year end.

Search Criteria
“I wouldn’t touch that stock”
“They have huge competition”
“That business model is dead”
“That country is fucked”

These are types of reactions we are looking for in our basket of names. We believe this basket can perform and pay a very quick 10%-15% still after this current rally, will look to enter on dips.


RIMM
BAC
C
GS
EEM
EWZ
NFLX
RSX
SLV
FXI
XLE


Tuesday, October 11, 2011

Looking for pain - Trade Idea

Looking for pain - Trade Idea


The current state of the market is one of confusion, distrust and fear.  The only guys that seem to be getting it correct are the technical nimble traders.  Everything else just doesn’t seem to be working.  The market has consistently or near perfectly traded well along short term trading signals that are available to anyone for free with an e-trade account.  Yet the folks with multi-factor correlation models of mass sophistication and large fee’s are nowhere close to performing well as the index.

Performance pain


Most traders discounted gold some time ago, others have called for bubbles and yet it has defied all logic and performed well.  On the flip side, the financials stock that employees most of the financial guru’s have collapsed. (-25%)

2011 YTD, as of September 30, 2011 Ranging from +15 to -25%

BEST
+15% Barclays 7-10yr
Treasury ETF
Gold
UTILITIES
CONSUMER STAPLES
HEALTH CARE
Dow Jones/Credit Suisse
Global Macro


0%$/Euro

TELECOM SERVICES
DJ/CS Blue Chip
Hedge Fund Index
Dow Jones/Credit Suisse
Long Short Equity
CONSUMER DISCRETIONARY
INFORMATION TECHNOLOGY
Russell 1000 Growth

-10% S&P 500
Nasdaq
Dow Jones/Credit Suisse
Event Driven
Lipper Large-Cap Core
Mutual Fund Index
Russell 1000
ENERGY
Russell 1000 Value
Crude Oil
INDUSTRIALS
Russell 2000
MATERIALS
-25% FINANCIALS
WORST


Long Short Pain
A great example is the simple metric of using DIA/IWM for Long/Short Funds.  The funds before the recently rally were totally off-side and it’s still not clear if we are entering a new range landscape or will revert to any sort of mean.


Tail Event Pain
For fund managers that reached for protection before and during the crisis, the protection trades became victim to large drops in volatility and skew levels.  What seemed to be safe bet and paying anywhere between 5-10% for protection is now heavily discounted and the market has yet to go anywhere.  What to do with all these puts now?


Spread Pain
For volatility traders, it seemed as a safe bet to be long Euro Stoxx vol and short SPX vol to play the Euro default for vol outperformance.  That trade as we can see from the below graph shows that spreads have collapsed.  Is it the right time to buy this cheaper tail?


Term Structure Pain
Variance Swap term structure has also massively inverted from this recent rally.  This type of pain on the street is possibly the worst, because it requires traders to go almost line by line and investigate all positions on the books and understand all the moving parts.  This usually results in traders crossing many spreads to get the exact trades off the books.  This will take time to filter through the markets


What did nobody do?

  • Buy Calls
  • Expect a rally
  • Keep low cash levels
  • Not buy risk management tools
  • Stay market weight financials


What is the max pain path in the market short term?

  • Up
  • lower volatility levels
  • Raise in longer dated vols
  • Europe/SPX spreads blowing out
  • Interest rates raising
  • Gold/Defensive stocks sinking
  • Financials/Materials raising
  • IWM sinking and Blue chips outperforming


Moving from the current market to even a greater high will require a large upside participation from global financial stocks (~ .75 Book)  PFG feels the best way to capture the max pain path is to buy short term calls on XLF.