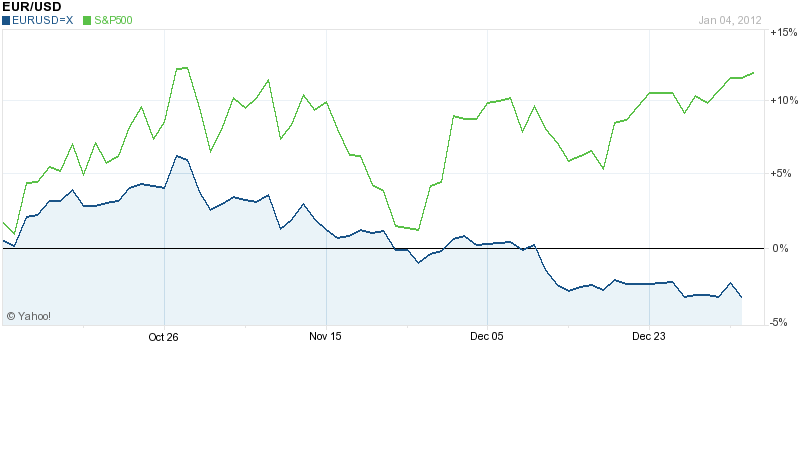
Taking ⅓ off the table: YTD Performance and Visual Recap of Global Volatility Levels
We are going to unwind ⅓ of our gamma fund (gamma will also expire tomorrow) and keeping our vega fund the same, currently with average short vega of 2.5y.
| Fund Changes by 1/3 | YTD Performance |
| XFN/XLU | 12% |
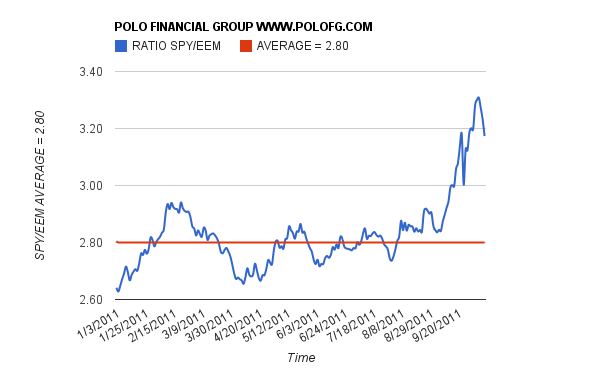
| EEM/SPX | 4.2% |
| Long/Short | 2% |
| Bond | 2.6% |
We learned last year, moving in thirds was the best way to enter and exit into positions. Our vega fund has performed well YTD (approx 2.3 vega points) and we continue to believe in lower long term volatility.
Our gamma positions that expire tomorrow were the worst performers (-2%) as it would have been cheaper and easier to simply buy dips and not pay 13 vol, what proved to end up realizing ~ 8 vol close to close.
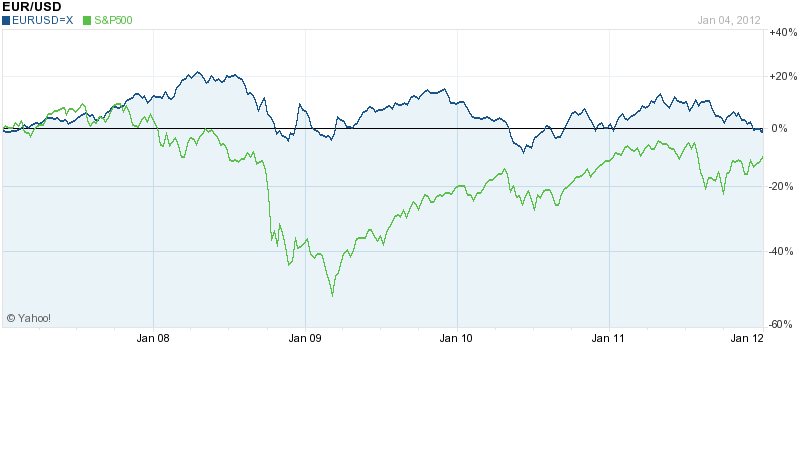
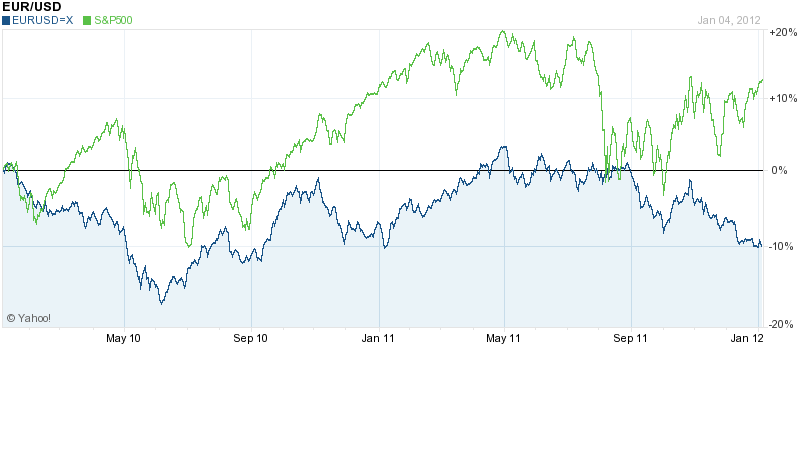
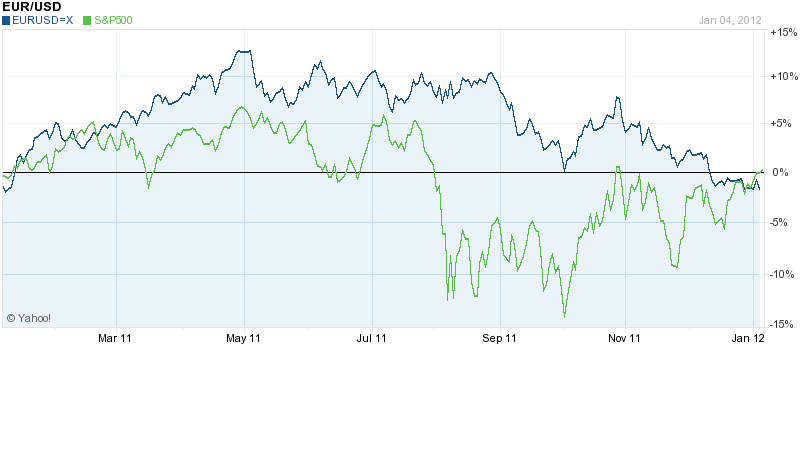
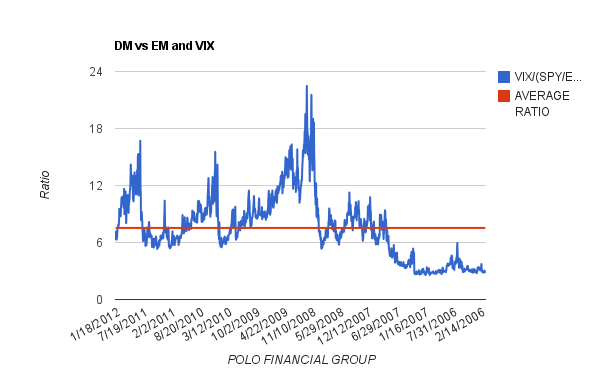
1. VIX drifted downwards and is now below 20, we see some value in owning short dated gamma from a risk reward basis, however best left to single stock pickers, rather then SPY. From this 5 year graph below (right to left) if we are entering the ever feared 2004-2007 vol world, things on the vix can get a lot worse.
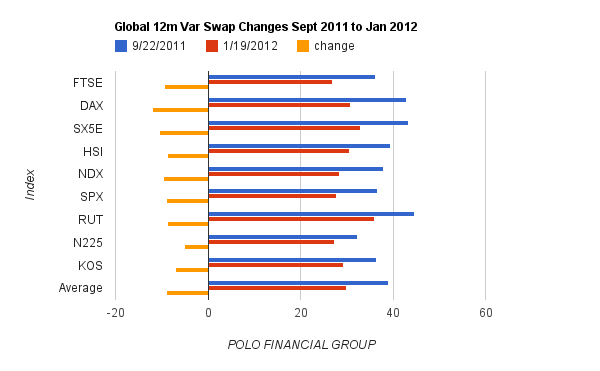
Globally, from the Sept highs, long dated vol has collapsed on average 10 points
2. We are removing ⅓ as we believe we still have plenty of performance left in our trades, but we want to keep a bullet to add more.