 Looking back at the VIX since 2006 - What can we learn?
PFG decided to have a look at the VIX settlements going back to 2006 to understand the velocity of the VIX between months, what January VIX tells us about the year and some other interesting facts we discovered. We expect to continue to mine simple data to sharpen iron condor trades for 2012
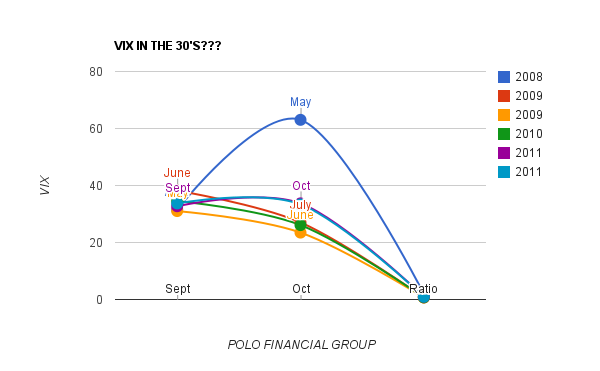
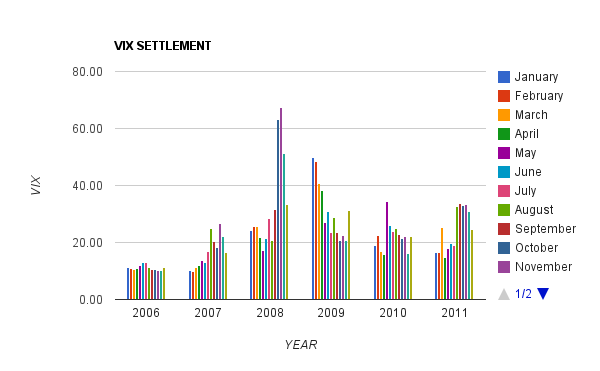
1) This is the first time VIX has had 30’s settlements back to back for 3 months, we have never had that before. After Lehman, in fact we have had a constant .75 ratio in the following month (i.e VIX drops 25%)
Vix in 30's
Years/Month Sept Oct Ratio
2008 31.54 63.04 2.00
April May
2009 38.2 27.05 0.71
June July
2009 31.03 23.48 0.76
May June
2010 34.53 26.11 0.76
August Sept
2011 32.73 33.72 1.03
Sept Oct
2011 33.72 33.36 0.99
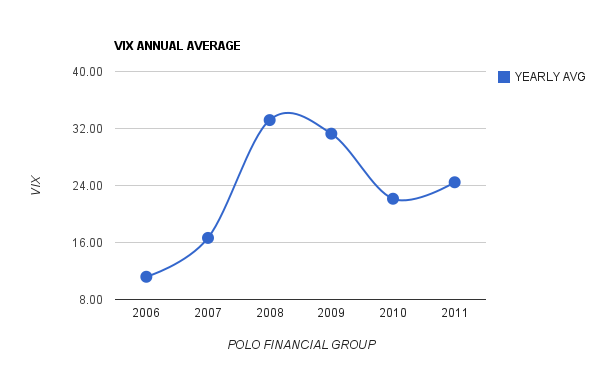
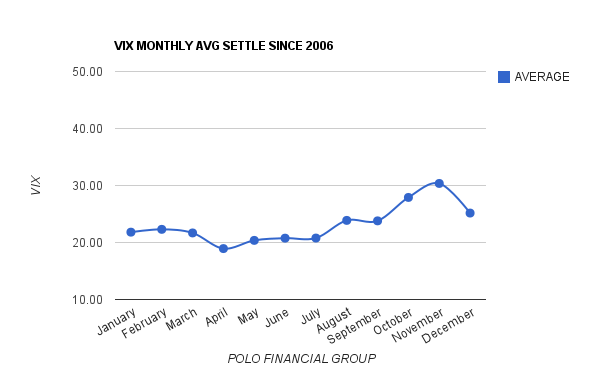
2) VIX annual averages are trending higher still years after Lehman point
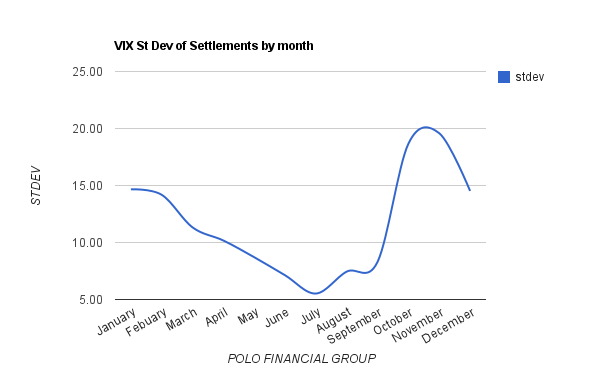
3) VIX April to September Standard Deviations stay <10 on Average. Outside of that they explode
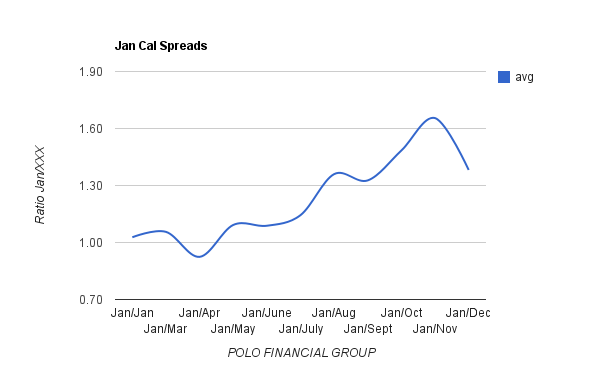
4) January sets the tone for the year. Outside LEH, Jan calendars are best bought. The preceding months will always have a higher VIX settle on average
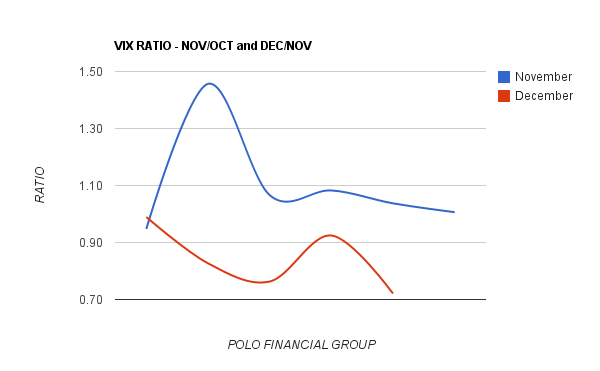
5) This one is really interesting. Nov VIX has always closed higher then Oct VIX, Dec VIX has always closed lower then Nov
6)The second half of the year is where the action is.
No comments:
Post a Comment